JPEG Quality 50–90: What 20 Real Images Actually Told Us
We re-encoded 20 images at five quality settings with the browser's own JPEG encoder and measured what actually happens to file size and fidelity. Some of the results contradict common compression advice.
The Question
Search for "best JPEG quality" and you'll find the same advice everywhere: "60–80 is a good range", "never go below 50", "quality 90 looks identical to 100". What you won't find is data — file sizes and fidelity numbers measured on real images, with the encoder you'd actually be using.
This study asks three concrete questions:
- How much smaller does a file actually get at each quality step from 50 to 90?
- How much fidelity is lost at each step, measured rather than eyeballed?
- Does the answer change depending on what kind of image it is?
Method
Test set — 20 images, four kinds of content:
| Group | Count | Dimensions | Source format |
|---|---|---|---|
| Photographs | 10 | 1600×1200 | JPEG |
| UI screenshots | 4 | 1600×1000 | PNG |
| Text documents | 3 | 1240×1754 | PNG |
| Flat illustrations | 3 | 1600×1200 | PNG |
The photographs are real-world photos (landscape, people, textured scenes) at 1600×1200. The screenshots are genuine captures of this website's pages. The documents are dense-text pages representative of scanned or exported documents. The illustrations are flat-color vector-style art.
Encoder: every image was decoded and re-encoded through an HTML5 canvas in Chromium 151 (Windows 10), calling canvas.toBlob('image/jpeg', q) at quality 0.50, 0.60, 0.70, 0.80 and 0.90. This is the exact code path our Image Compression tool uses — the browser's built-in libjpeg-based encoder, the one you get when you compress images in any modern web app. No command-line tool, no different codec family.
Fidelity metric: SSIM (structural similarity, grayscale, 11×11 Gaussian window, σ = 1.5) between the lossless decoded original and the re-encoded result. SSIM ranges from 0 to 1; values above ~0.98 are usually visually indistinguishable, and below ~0.95 differences start to be noticeable.
File size: actual encoded bytes, reported relative to the original file's size (1.00× = no change).
Environment: Chromium 151.0.7922.34, Windows 10 Pro, 2026-09-29. The main run encodes 20 images × 5 qualities (100 encodes); a supplementary run re-encodes the 10 photographs from a lossless PNG source × 6 qualities (60 more). The complete per-image results are published as raw data: r1-results.json.
Results 1: Photographs — Q70 Saves Almost Nothing
Averages across the 10 photographs (all 1600×1200, original files already JPEG-compressed):
| Quality | Mean size | vs original | SSIM (mean) | SSIM (worst) |
|---|---|---|---|---|
| 50 | 149 KB | 0.77× | 0.9588 | 0.923 |
| 60 | 172 KB | 0.89× | 0.9827 | 0.970 |
| 70 | 191 KB | 0.99× | 0.9954 | 0.993 |
| 80 | 207 KB | 1.07× | 0.9958 | 0.993 |
| 90 | 241 KB | 1.25× | 0.9978 | 0.996 |
The most practical finding of this study: at quality 70, the re-encoded photo was on average 0.99× the original size — essentially no savings at all. The sources in our test set were themselves JPEG-compressed photos, and re-compressing an already-compressed JPEG at a similar quality level is close to a no-op. Real savings only begin once you go below the source's effective quality:
- Q60: 11% smaller, SSIM 0.98 — still visually clean.
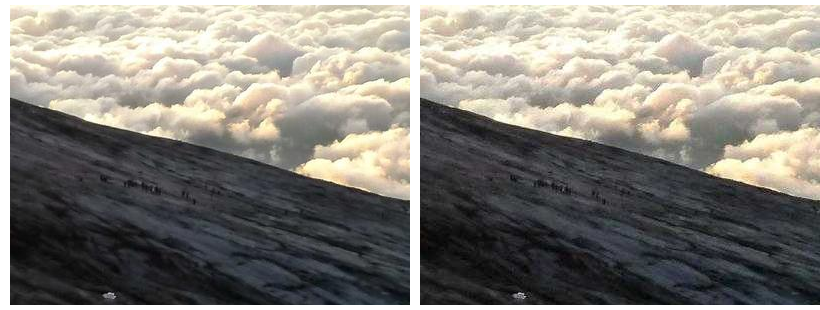
- Q50: 23% smaller, SSIM 0.96 — visible only if you look for it (see the comparison below).
Meanwhile Q90 grew files by 25% with no meaningful fidelity gain over Q80. Re-encoding photos at high quality doesn't preserve quality — it just costs storage.
What if the source is lossless? The numbers above describe the common real-world case of re-compressing an already-JPEG photo. So we ran a supplementary pass: we decoded each of the 10 photos to a lossless PNG (average 2,434 KB — this is what an uncompressed photo of this size actually weighs) and re-encoded that through the same canvas encoder:
| Quality | Mean size | vs lossless PNG | SSIM (mean) |
|---|---|---|---|
| 50 | 149 KB | 0.059× | 0.9588 |
| 60 | 172 KB | 0.068× | 0.9827 |
| 70 | 191 KB | 0.076× | 0.9954 |
| 75 | 156 KB | 0.078× | — |
| 80 | 207 KB | 0.082× | 0.9958 |
| 90 | 241 KB | 0.095× | 0.9978 |
The perspective shift is dramatic: from a lossless source, every quality setting is a massive win — even Q90 removes 90% of the weight. The slider now only trades a 1.6× size difference (Q50 vs Q90) against fidelity, which is why Q75–80 is a comfortable default here: the fidelity gain over Q60 is real (0.996 vs 0.983), and the extra cost is just 2% of the lossless size.
Here is a center crop of one test photo. Left: lossless reference. Right: quality 50:
Results 2: Screenshots — JPEG Works, but It's the Wrong Format
Averages across the 4 UI screenshots (1600×1000, PNG sources):
| Quality | Mean size | vs original | SSIM (mean) |
|---|---|---|---|
| 50 | 65 KB | 0.54× | 0.9877 |
| 60 | 73 KB | 0.60× | 0.9896 |
| 70 | 83 KB | 0.69× | 0.9918 |
| 80 | 100 KB | 0.82× | 0.9946 |
| 90 | 133 KB | 1.09× | 0.9976 |
Converting a PNG screenshot to JPEG at Q50 halves its size, and SSIM stays high. But the artifacts JPEG introduces on flat UI surfaces and text edges — ringing along borders, slightly dirty whites — are exactly the kind of damage screenshots are sensitive to. If you need a screenshot smaller than PNG, a lossless or near-lossless format (WebP lossless, or lossy WebP at high quality) usually beats JPEG for this content type. That comparison is exactly what our planned Study 02 (WebP vs JPEG) will measure.
Results 3 & 4: Text Documents and Flat Art — JPEG Makes Files Bigger
Text documents (1240×1754, PNG sources) and flat illustrations (1600×1200, PNG sources):
| Quality | Documents: vs original | Documents: SSIM | Illustrations: vs original | Illustrations: SSIM |
|---|---|---|---|---|
| 50 | 1.06× | 0.9713 | 2.26× | 0.9786 |
| 60 | 1.17× | 0.9768 | 2.48× | 0.9813 |
| 70 | 1.32× | 0.9834 | 2.82× | 0.9317 |
| 80 | 1.55× | 0.9895 | 3.35× | 0.9881 |
| 90 | 1.95× | 0.9965 | 4.36× | 0.9939 |
For both content types, JPEG was the wrong tool at every quality level:
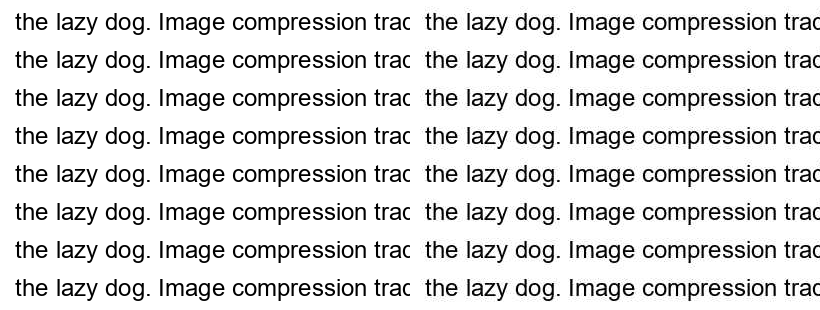
- Text documents got bigger, not smaller. PNG's lossless run-length-style compression is extremely efficient on crisp text; JPEG's 8×8 DCT blocks smear the sharp glyph edges and cost more bytes doing it. At Q90 the JPEG was nearly double the PNG. Converting scanned text pages to JPEG to "save space" does the opposite.
- Flat illustrations inflated 2.3–4.4×. Same mechanism: PNG stores large flat regions almost for free, while JPEG has to encode every 8×8 block.
The anomaly worth knowing about: notice the illustrations' SSIM at Q70 — 0.9317, worse than Q50's 0.9786, while the file is bigger. This inversion reproduced consistently on all three illustrations. The likely mechanism is the interaction between JPEG's 8×8 block quantization and chroma subsampling on large flat saturated regions: at mid-range qualities, residual DCT coefficients are kept just precisely enough to form visible block boundaries on flat color, while at Q50 heavier quantization smooths those regions flat instead. In other words, on flat art there is a quality band (in our test, around Q70) that is simultaneously bigger and more artifacted than Q50. We haven't seen this covered in mainstream compression guides — it's exactly the kind of thing generic advice misses.
Here is the same effect on a text document. Left: lossless reference. Right: Q50 — note the ringing around glyphs, and remember this file is 6% larger than the PNG it came from:
Conclusions
| Your image is… | Best move (from our data) |
|---|---|
| A photo (already JPEG) | Re-encode at Q60–Q70: Q70 ≈ breaks even on size, Q60 saves ~11% with SSIM 0.98. Only go to Q50 when you need the 23% and can tolerate minor texture softening. Never re-encode at Q80+. |
| A photo (raw/uncompressed) | From a lossless source, any JPEG quality is a huge win — even Q90 is 9.5% of the PNG's weight (measured, see Results 1). Q75–Q80 is the comfortable default: SSIM 0.996 for about 8% of the lossless size. Go lower only if the extra 20% relative saving matters. |
| A screenshot / UI capture | Stay lossless (PNG) or use WebP; if JPEG is the only option, Q80+ and accept ~0.8× size, or Q50 to halve it at the cost of text-edge ringing. |
| A text document / scan | Don't convert to JPEG at all. PNG (or PDF) is smaller and artifact-free at every quality level we tested. |
| Flat illustration / graphics | Keep PNG, or use a lossless WebP. If you must use JPEG, avoid the Q60–Q75 band — our data shows it can be bigger and more artifacted than Q50. |
Three takeaways we'd highlight over the usual "60–80 is fine" advice:
- Quality settings are not absolute. What Q70 does depends on what the image has been through already — an already-compressed photo gains almost nothing at Q70, which most guides never mention.
- JPEG is a photograph format. For text, UI and flat art it consistently lost to PNG on both size and fidelity in our test.
- Mid-quality JPEG has a trap zone on flat content. If your image has large flat color regions, Q50 may genuinely beat Q70 on both axes.
Limitations & What's Next
An honest study states what it doesn't cover:
- 20 images is enough to expose the patterns above, but per-image variation is real — a noisy high-ISO photo behaves differently from a clean studio shot. Our per-image data (published above) spans SSIM 0.92–0.98 at Q50.
- We measured SSIM, not human judgment. SSIM correlates well with perceived structure loss, but a formal viewer study would be stronger evidence.
- The photo sources were themselves JPEG-compressed (as most real photos are). Findings about "already-compressed" photos specifically reflect that common real-world case — the raw-photo case is called out separately in the conclusions.
Next studies: Study 02 — WebP vs JPEG will measure whether the format switch beats the quality slider, and Study 04 will look at what EXIF metadata survives this whole process.
Try It on Your Own Images
Every measurement above came out of the same encoder our compression tool exposes. Put your own photo through it and compare — the numbers you get are the numbers this study describes: